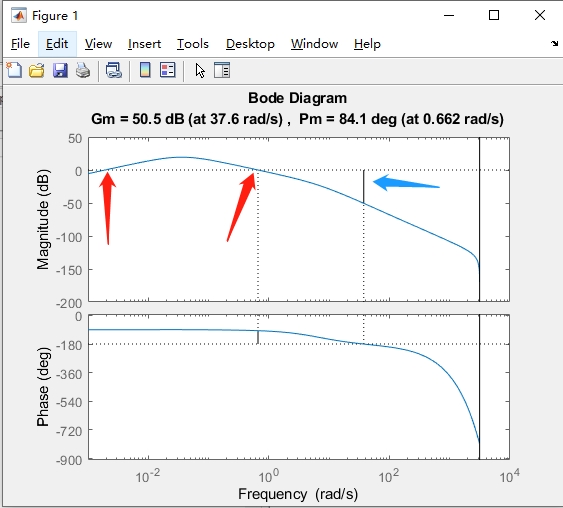
I have a high order discrete transfer function model which has the following form. When I use the allmargin function to get the gain margin, I get the following result:
G_uncoupled = tf(1,[0.25 0.5 0]);
G_uncoupled_d = c2d(G_uncoupled,0.001,'zoh');
D_d = tf([1 -1],[0.001 0],0.001);
H_d = tf([(1 - exp(-10*2*pi*0.001)) 0],[1 -(exp(-10*2*pi*0.001))],0.001);
delay_d = tf(1,[1 0],0.001);

L_uncoupled = (G_uncoupled_d*delay_d^3)/(1 + G_uncoupled_d*D_d*H_d^1*1*delay_d^3);


marginInfo = allmargin(L_uncoupled);
marginInfo =

  struct with fields:

     GainMargin: [336.0257 9.8081e+05]
    GMFrequency: [37.5848 1.7955e+03]
    PhaseMargin: [90.0569 84.1254]
    PMFrequency: [0.0019 0.6617]
    DelayMargin: [8.2179e+05 2.2191e+03]
    DMFrequency: [0.0019 0.6617]
         Stable: 0
When I plot the bode plot of this transfer function, I get the following graph, from the graph I can see two phase margins, but I only see a gain margin 336.0257(50.5dB) at 37.5 rad. For the second frequency 1.7955e+03, I can't see the gain margin at this frequency from the Bode plot, how did MATLAB get this value or what does this value represent?
