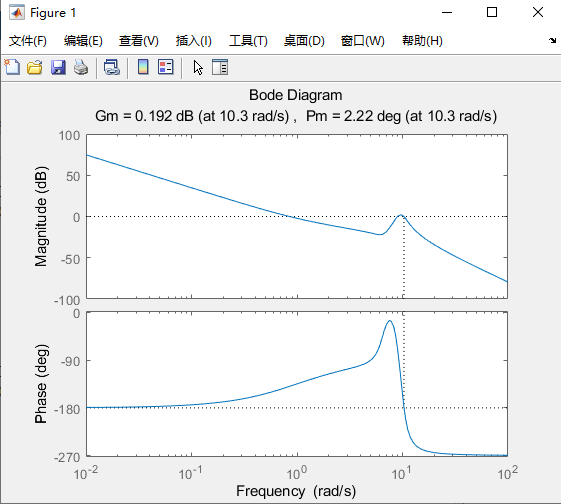
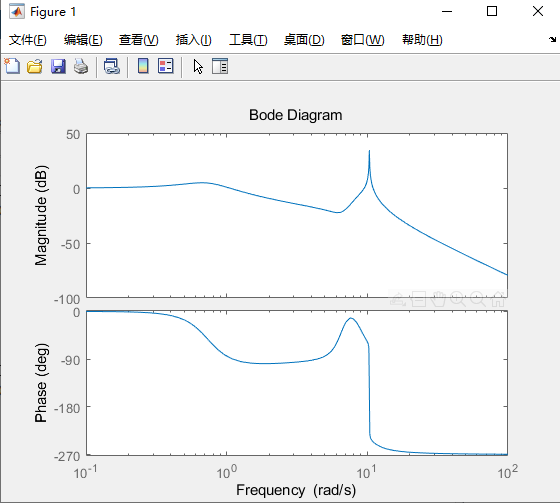
A Bode plot is sufficient to tell you how much margin there is (both phase and gain) before a pole or pole pair in a system crosses the stability boundary -- but it does not, by itself, tell you if the system started out stable.
If you start with the prior knowledge that the system was, indeed, stable, then the Bode plot is very useful in determining gain and phase margins, and in tuning the system for better performance from a known stable starting point. This is the case even in the case for a system that starts out with more than 180 degrees of lag, as in the rare but not unheard of case of a type III or higher system.
A Nyquist plot is very handy for telling you whether a system is stable enough, but you still need prior knowledge. In this case, you need to know the number of unstable zeros in the system. I have yet to work on a system where there was any question about this by the time I got to the step of designing a controller, but if I did, I could start with a known-stable system and make a Nyquist plot of it.
Note that if you do have a type III system, or one that has three or more low-frequency poles that you're closing around, then you have at least two gain margins: a low-frequency margin that defines the minimum gain for stability, and a high-frequency one that defines the maximum gain for stability.

