TL;DR Your calculations are correct. As stated by [1], "In flow situations that are insensitive to Reynolds number, or where a test Reynolds number is close to that of a full-size vehicle, water tunnels should be regarded as the preferred option for experimental aerodynamics". Water tunnels are regarded as a valid approach, but the applicability need to be assessed on a case-by-case basis, mostly due to the discrepency often seen in the Reynolds number.
Since the obective of the video is to give a basic understanding of the flow, I consider the simplifications valid.
Since the topic at hand is way to large to be satisfactory explained in a SE answer, I highly recommend those interested to have a look at [1]. They greatly compare and discuss the differences in using wind and water tunnels for areodynamic problems. Rather than motor vehicles, their study is focused around air vehicles, which also suits your question.
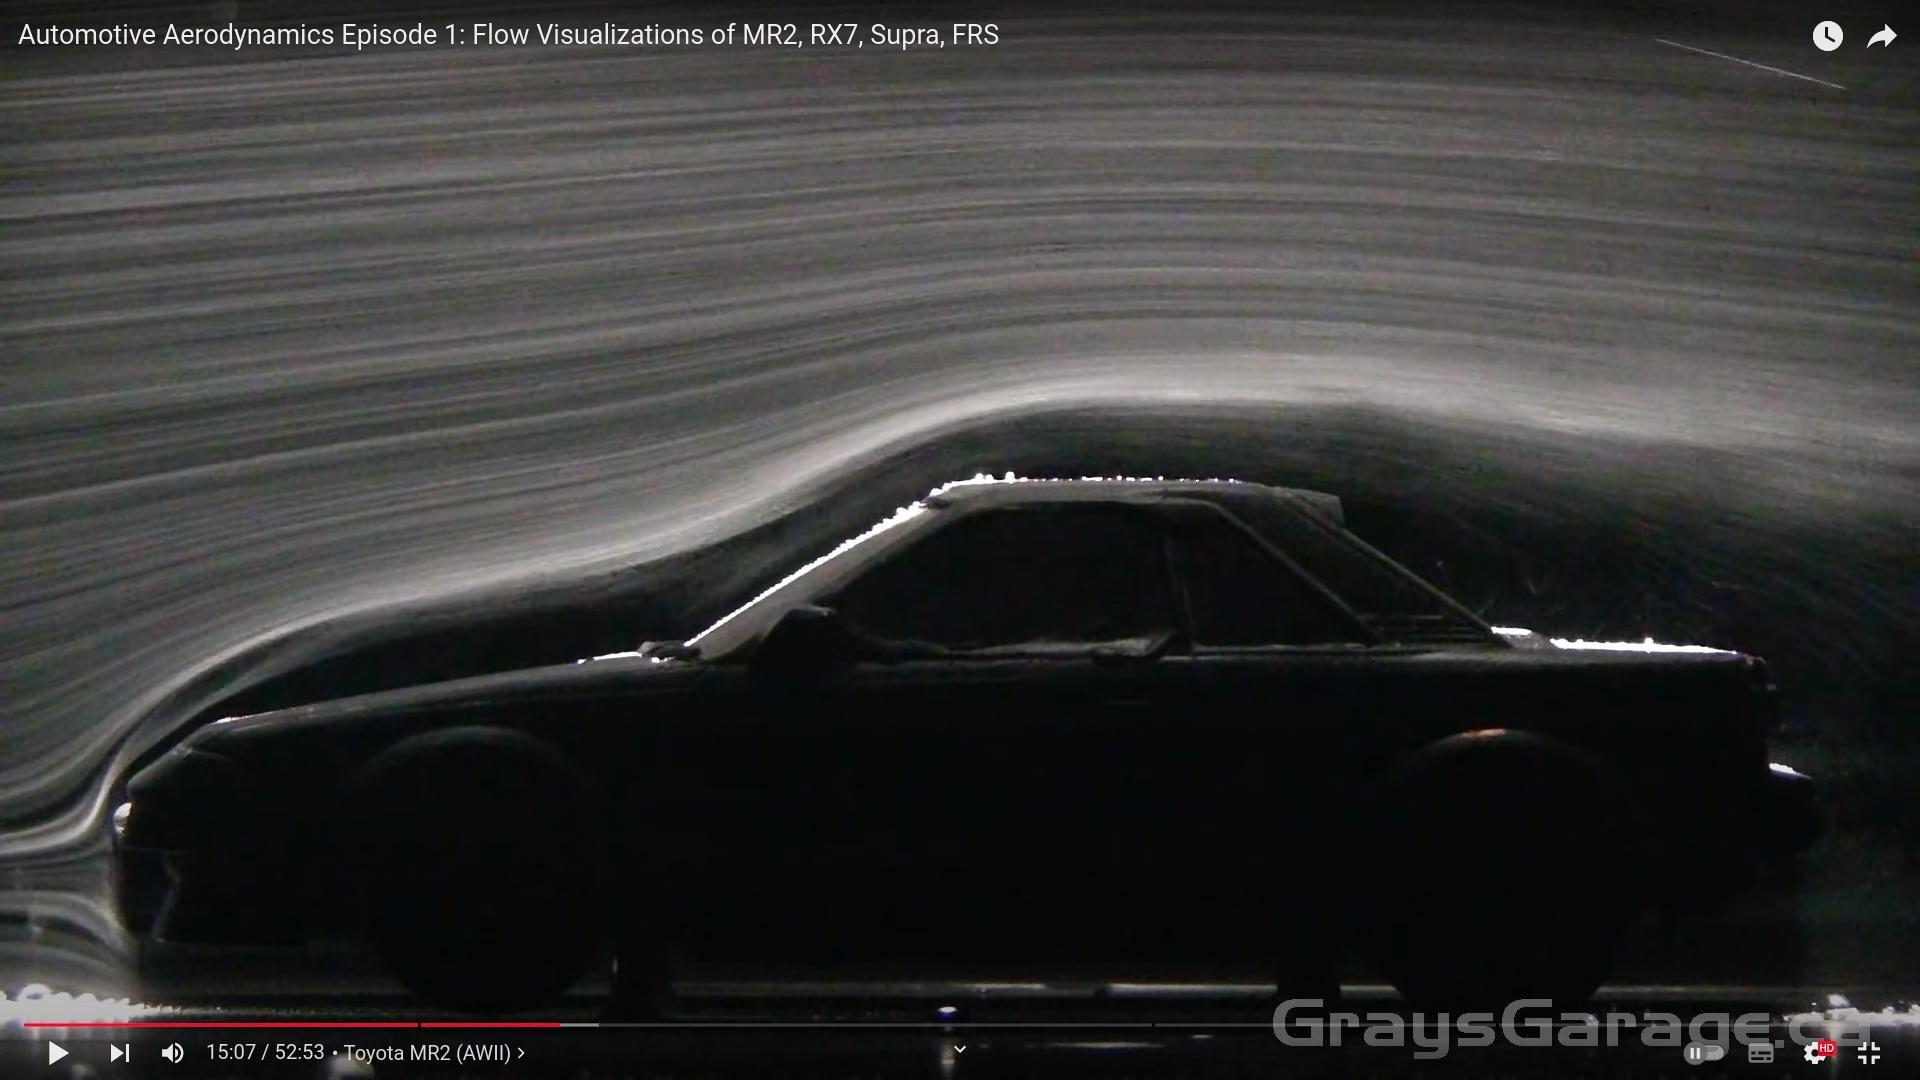
In the YouTube video you are referencing, from about 5:00-9:00, GraysGarage briefly describes some methods for experimental fluid dynamics, stating that the current objective is to investigate the flow pattern. By not aiming to calculate e.g. drag and lift forces, some scaling errors w.r.t. to the Reynolds number may be neglified.
I suspect the main reason for using a water tunnel in this case is the decreased free-stream velocity obtained due to the high viscosity of water compared to air. This enables easier visualization of complex flow patterns, and consequently a better understanding of the flow dynamics.
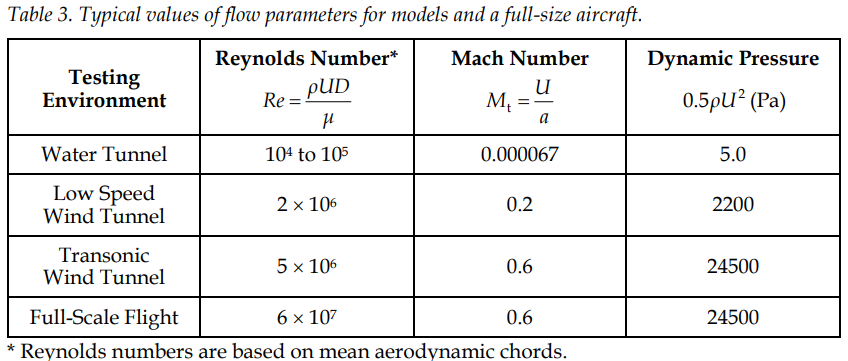
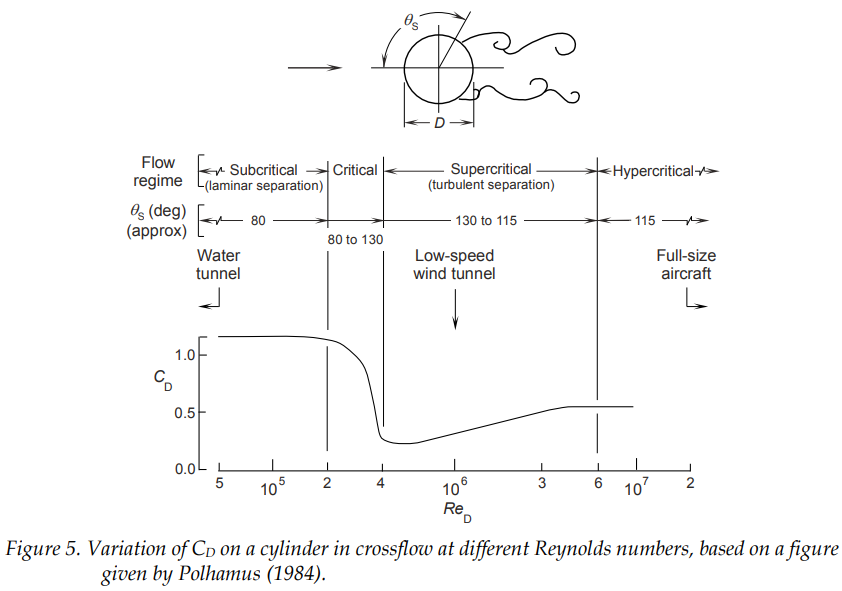
However, for the flow pattern obtained in a water tunnel to be representative for a real-life scaled model, some criterias must be satisfied. As is given in Table 1, "the Reynolds number for tests on a model in a water tunnel is at least three orders of magnitude less than that for tests on a full-size vehicle" [1]. For cases where Reynolds numbers are of high importance, such as flow around a circular cylinder, this difference is crucial when interpreting the results. An example of this is seen in the drag coefficent as a function of Reynolds number in Figure 1. [1] states that "Loads measured and flow patterns captured in water tunnels for models with rounded leading edges do not scale well to full-size vehicles, due to different types of boundary layers and separation locations for the two cases". Interestingly, it should also be noted how the use of a wind tunnel still has a difference in Reynolds number when investigating air vehicles, suggesting that care should also be taken when extrapolating such results.
Since the flow patterns of the cars investigated by GraysGarage are dominated by mostly sharp edges in the geometry, I personally believe the flow patterns obtained are representative for use in obtaining a basic understanding of the flow. As GraysGarage also points out, more detailed methods must be applied to achieve the full flow pattern. Then, as is somewhat discussed in the comments on his YouTube video, one should also consider the error obtained by the stationary wheels, which in reality will have large effects on the flow. However, such an analysis was never the intent of GraysGarage, so I therefore consider it off-topic.
 Table 1 Table from [1, p. 4]
 Figure 1 Figure from [1, p. 10]
Lastly, [2] is attached to give some further insight to the benefits and drawbacks of flow visualization using Hydrogen Bubbles. GraysGarage also touches on the topic, describing how the use of e.g. dye is disregarded due to the contamination of the water and the following purification needed to start over again. Another benefit is the possibility to create pulses of bubbles travelling downstream, as is applied in the video. This gives a unique possibility to watch how each "particle" behaves inside the flow.
[1] Erm, Lincoln P. & OL, Michael V. (2012). An Assessment of the Usefulness of Water Tunnels for Aerodynamic Investigations. URL: https://apps.dtic.mil/sti/pdfs/ADA582450.pdf
[2] Smith, Charles & Sabatino, Daniel & Praisner, Thomas & Seal, Charles. (2012). Hydrogen Bubble Flow Visualization. URL: https://www.researchgate.net/publication/303784988_Hydrogen_Bubble_Flow_Visualization


