3
$\begingroup$

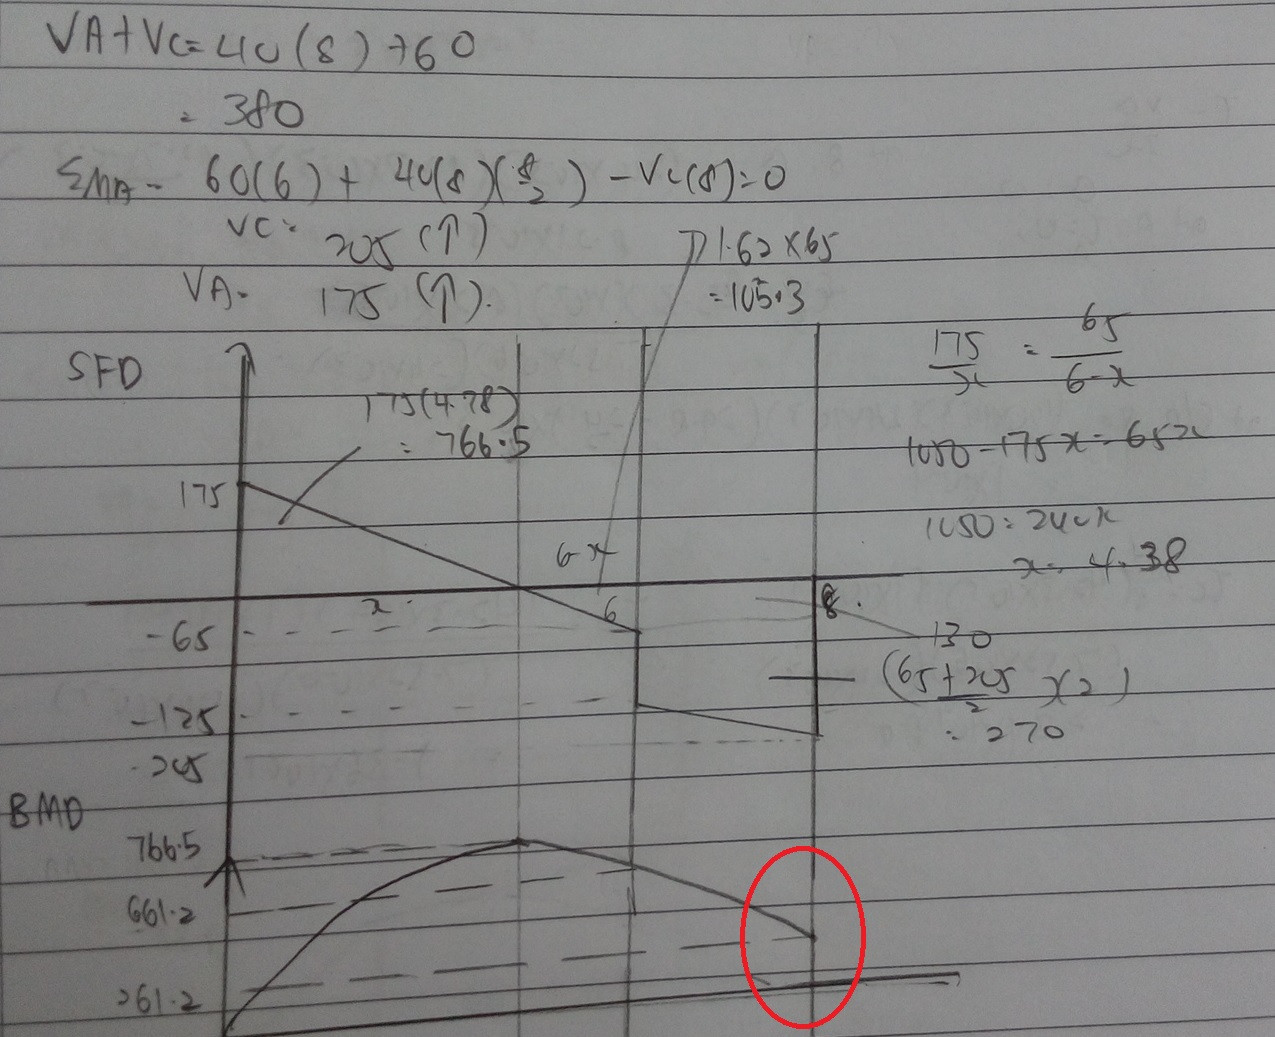
In this question my bending moment diagram (BMD) doesnt return to 0, what's wrong with it?

To get the bending stress $\sigma = My / I$ , so i have to get the M (maximum moment) first.

To get the maximum bending moment, I have to get it from the graph of bending moment. To get bending moment, i have to get the shear force from the shear force diagram (SFD).

enter image description here

$\endgroup$
4
  • $\begingroup$ imgur.com/a/eiSj1 $\endgroup$ Commented Nov 5, 2016 at 14:28
  • $\begingroup$ Please ask additional questions as separate questions. Previous edit removed. $\endgroup$
    – AndyT
    Commented Nov 7, 2016 at 12:44
  • $\begingroup$ Can you please send me back the edit that you have deleted ? I have asked this few days ago . I forgot what i asked $\endgroup$ Commented Nov 7, 2016 at 12:47
  • $\begingroup$ Click on the bit above my logo which says "edited 1 hour ago" and you can see the full edit history. $\endgroup$
    – AndyT
    Commented Nov 7, 2016 at 14:19

1 Answer 1

3
$\begingroup$

Your shear diagram is correct.

Bending moment is equal to the integral of shear. Therefore, the point of maximum bending moment is the point of zero shear. I can see you calculated that point as 4.38, which is correct (in fact, it's 4.375, but rounding is fine). That is found by

$$6\cdot\dfrac{175}{175+65} = 4.375\text{ m}$$

Now you know the point of maximum bending moment. You chose to calculate the value by integrating the shear diagram. That is equivalent to calculating the total area of the shear diagram up to that point, which is equal to

$$175\cdot\dfrac{4.375}{2} = 382.8\text{ kNm}$$

Your mistake was that you calculated the area of the rectangle $(175\cdot4.375$) instead of the triangle that describes the shear diagram.

Adopting the correct bending moment value, you can then correct the rest of it as well: $$\begin{align} M_B &= 382.8 - 65\cdot\dfrac{6-4.375}{2} = 330.0\text{ kNm} \\ M_C &= 330.0 - \dfrac{125+205}{2}\cdot2 = 0\text{ kNm} \end{align}$$

And now, to check our work:
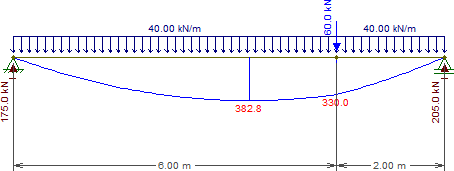
enter image description here

Diagram obtained with Ftool, a free 2D frame analysis program.
$\endgroup$

Your Answer

By clicking “Post Your Answer”, you agree to our terms of service and acknowledge you have read our privacy policy.

Not the answer you're looking for? Browse other questions tagged or ask your own question.