0
$\begingroup$

I will be performing some tests and measuring the vibrations of a planetary gearbox. The accelerometer I will be using stays attached to the gearbox and saves the data into a log, which is available after the test is finished.

My main objective is to extract the natural frequencies of the accelerometer data and compare them with a simulation derived from an analytical model.

What is the best method for the signal conditioning of the accelerometer data? I don't understand if the steps between, do I need to have an Integrator for determining the velocity and displacement also, or will a direct fourier analysys like the fft will yield the natural frequencies?
$\endgroup$

2 Answers 2

2
$\begingroup$

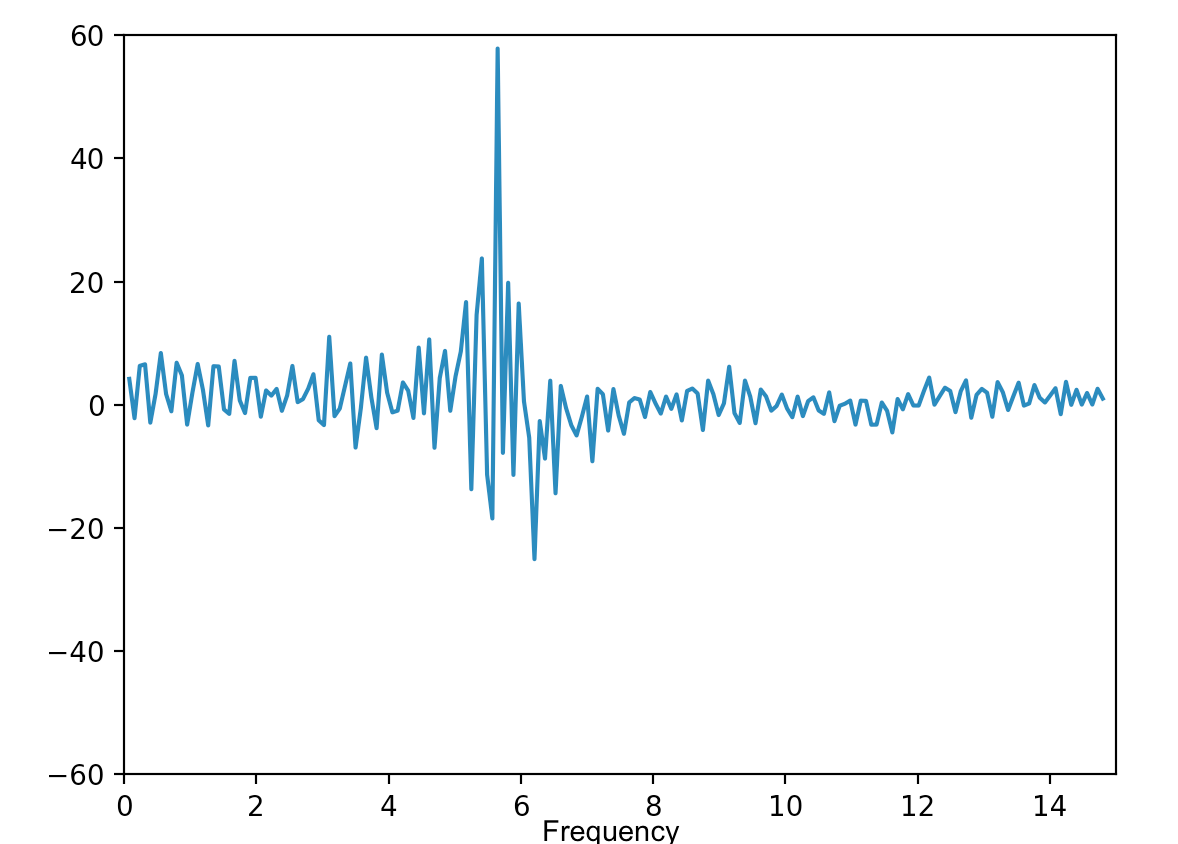
It depends on what your data looks like. I recently got some accelerometer data that looked like this after running it through Python's Scipy fft function: enter image description here The results are pretty straightforward- natural frequency at about 5.5 Hz. In that particular case, the analysis was basically trivial- 20 lines of python, most of which was importing and plotting.

If the frequency domain data looks nastier, there are lots of post-processing tools like scipy's find_peaks_cwt. The details of which of those are best is more a question for SO, and you'll find lots of questions (including my own) on the topic over there.

In short, the first step should be trying to shove it through fft. If that doesn't work well, you can either follow up here with more details on how to improve the hardware/data collection, or with SO to clean the data with existing software tools

$\endgroup$
2
  • $\begingroup$ I would be using Matlab but I believe the functions work almost the same. Where can I find the chain for the post processing topic you mentioned? Also, If my accelerometer has measurements in 3 axis, do I need to process each axis separately or is there a way to get an absolute signal? Additionally, the gearbox I will be measuring has multiple degrees of freedom, what tools can I use to classify all the different frequencies I will get? $\endgroup$
    – spe4ker
    Commented Mar 8, 2017 at 13:54
  • $\begingroup$ I don't have a specific set of questions in mind. Try searching stack overflow for "peak detection" or "find_peaks_cwt". I would think you would want the individual vectors but you could get a vector sum as sqrt(a_x^2+a_y^2+a_z^2). The FFT output should give you each of the different frequencies. It will just have several peaks, each one representing a different frequency. $\endgroup$
    – ericksonla
    Commented Mar 8, 2017 at 15:56
1
$\begingroup$

I've done this before. I had to be pretty careful to generate the FRF.

It helped me to know the input (force vs. time) and the output (acceleration vs. time). I have done it without knowing the input. I typically plot the FFT using a logarithmic scale. When you know the input, you divide the output by the input (in the frequency domain) and the peaks are much more obvious. Furthermore, you can look for a 180 deg phase shift and that typically identifies the peaks.

Good resources include: Modal Testing by Ewins or Mechanical Vibrations by Rao

$\endgroup$
3
  • $\begingroup$ If I have both the input and output then would that be like processing the transfer function, which would give me the stability of the system? or does it also yield the natural frequencies? I don't understand what you mean by looking for a 180° phase shift. I had a look at the Modal Testing book and it has very interesting methods although It's quite an old edition, Is there a more recent literature I can review which can take me straight to more modern methods? $\endgroup$
    – spe4ker
    Commented Mar 8, 2017 at 13:59
  • $\begingroup$ It is old, but the math is good. I haven't found anything that is a really good replacement. I'm not sure I understand your terminology "stability of the system". Natural frequencies are resonances. If you divide the output by the input, you should see a peak where the system resonates. What arises from the theory of single degree of freedom simple harmonic oscillators is that there is a 180 deg phase shift comparing phase before and after a resonant peak. This may help in discriminating noise from resonance. $\endgroup$ Commented Mar 9, 2017 at 2:11
  • $\begingroup$ I found another book called Introduction to Operational Modal Analysis by Brincker, is it the same approach or does the "operational" mean something else? $\endgroup$
    – spe4ker
    Commented Mar 9, 2017 at 17:57

Your Answer

By clicking “Post Your Answer”, you agree to our terms of service and acknowledge you have read our privacy policy.

Not the answer you're looking for? Browse other questions tagged or ask your own question.