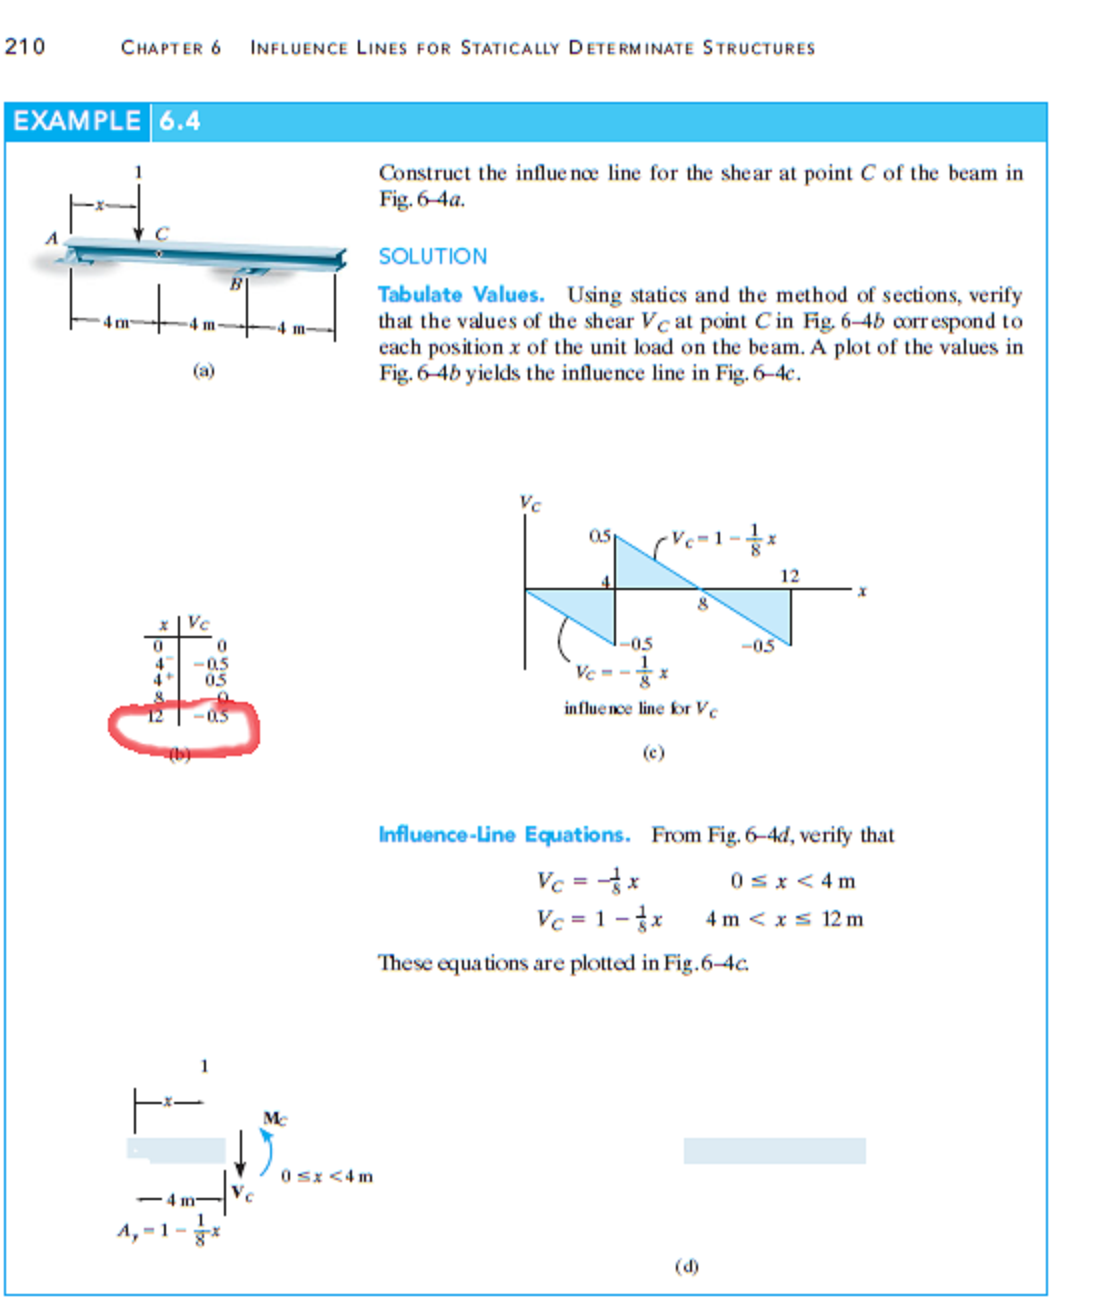
As @alephzero mentioned, you are misunderstanding how influence lines work.
To quote Wikipedia, "an influence line graphs the variation of a function (such as the shear felt in a structure member) at a specific point on a beam or truss caused by a unit load placed at any point along the structure."
So, in your case, the influence line shown describes how much shear will be felt at C when a concentrated unit load is applied at any given point along the beam.
For instance if you applied a concentrated downward unit force:
- at A, what would the shear force be at C? Zero.
- at B, what would the shear force be at C? Zero.
- immediately to the right of C? 0.5
- immediately to the left of C? -0.5
Or, more visually, here's the influence line at C (the red dot at midspan).

And here is the shear diagram for loads along the span. Notice that the shear value at C is always equal to the value shown in the influence line for the point where the load is applied.
For C, I applied the load a tiny bit to the left and right of C, so the value is a bit off from the 0.5 it should be:


So you see that the point where a concentrated load is applied is also a discontinuity in the shear diagram. The influence line is merely representing that: if you apply a load immediately to the left of C, the result is completely different than if you'd applied it immediately to the right of C.
Also notice that the difference between the left and right sides of the discontinuity point must be equal to the concentrated force (in this case, $-0.5 - 0.5 = -1$).
If C were not at midspan, then the diagram still would go from negative to positive, with a gap of 1. So, let's say C is just two meters away from A: in this case, the discontinuity will go from -0.25 to 0.75.


