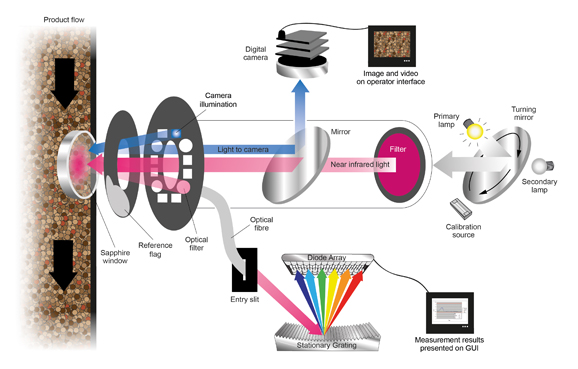
The simplest method will be a multi-step approach. The first step will be a defective product detection, that gathers general data about the product stream and quarantines defective products. On a parallel path, a small batch of samples will be also sequestered from the main line to be analyzed continuously for detectable defects. A laboratory analysis could then confirm size and count using digital tools.
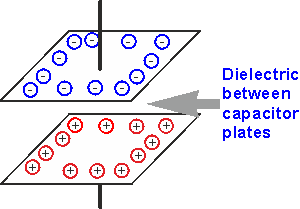
Recognizing that these are, for the most part, polarized plastics, they should have a fairly consistent low to modest relative permittivity, double to triple the value of air. Regardless of opacity and/or material, a product line with high amount of defects will be unpolymerized or coked plastics, consisting primarily of carbon, which has a detectable higher relative permittivity, nearly five times the value of even the most polar plastics. A static (ultra low frequency) dielectric detector can detect these defects, and quarantine the offending batch.

As the relative voltage across the plates changes, the increase in stored voltage can be detected as a defect for sequestering.
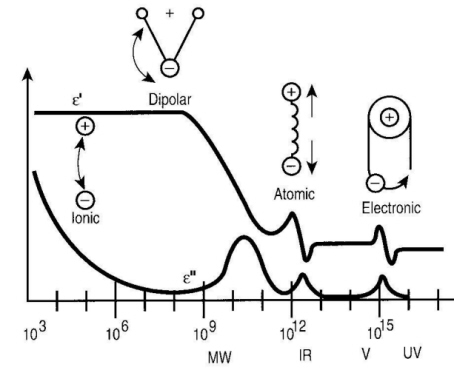
On a parallel path, a small portion can run through a dielectric spectrometer. These have had some uses before, (See here for detection of different polymers based upon response spectra, and here where it was used to detect areas of low polymerization in LDPE.) It works the same way as the dielectric detector, but uses an alternating current. This can get a full spectrum analysis for comparison between polymers:

Since this detection method is slower, it will need to be able to analyze samples one at a time. However, this will ensure the main detector is not fluctuating substantially due to contaminants in the air or other problems. It will also review a history of defective compounds. As the library of spectrum is built, this could replace entirely the need to utilize laboratory detection, except for the cases of control chart defects (see below).
Some advantages of this is that it can detect defects inside the beads that would not be visible via normal spectroscopy alone.
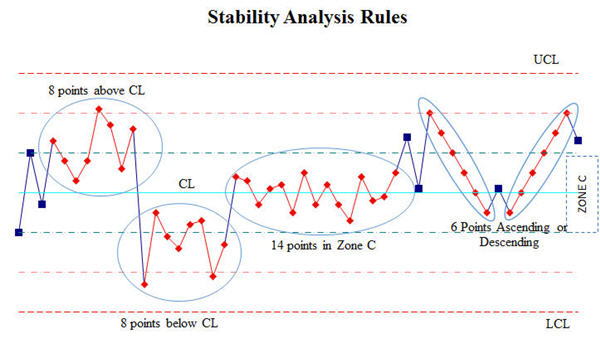
Final laboratory counts to measure black spots could then be utilized to verify the automated machines are working within parameters. The 7 tools of quality, particularly the control chart, will be useful as a countermeasure to ensure these detectors are working properly.


