0
$\begingroup$

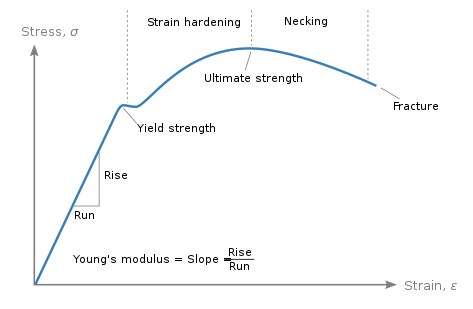
A significant barrier to my understanding of typical engineering stress vs. engineering strain curves is that for certain values of stress, there are multiple values of strain (i.e., the stress-strain curve is not invertible in the mathematical sense). This is an issue for me because in my mind, I make sense of stress-strain curves in terms of the tension test I'd conduct to make the plot. I imagine that in a tension test, tension is added to a specimen incrementally and at each increment, the specimen's strain is noted.

This simple experiment must provide a curve that is 1:1 in that every tension value corresponds to one strain value (and vice versa). Therefore, this experiment cannot lead to the tensions that correspond to the specimen's necking region which for one tension value have two strain values.

How must I modify my view of the tension test used in obtaining experimental stress-strain curves to improve my understanding of what the curves are working to communicate? I am sure most of you reading this know the typical stress-strain figure I have in mind, but I have provided a basic example from Wikipedia below just in case:
enter image description here

$\endgroup$

2 Answers 2

4
$\begingroup$

The stress-strain curve isn't created using a incremental load.

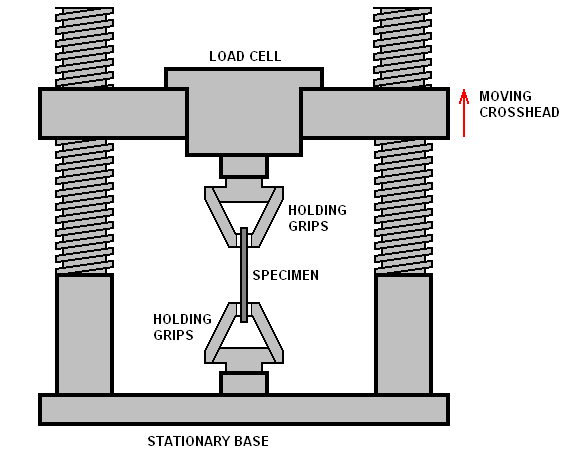
Instead what most standards for tensile testing nowadays require a constant displacement rate. I.e. you have a setup similar to the following (it may vary of course)

enter image description here

Figure: Tensile test setup (source engineeringarchives)

The crosshead (horizontal bar that the load cell is attacheds) moves at a constant rate. As the displacement changes, the load required changes. The end result is recorded values of displacement and force.


True stress-strain curve.

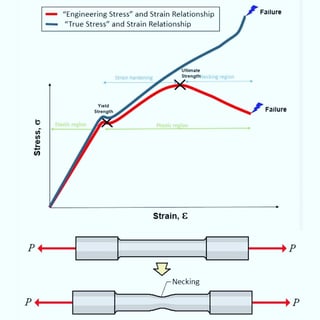
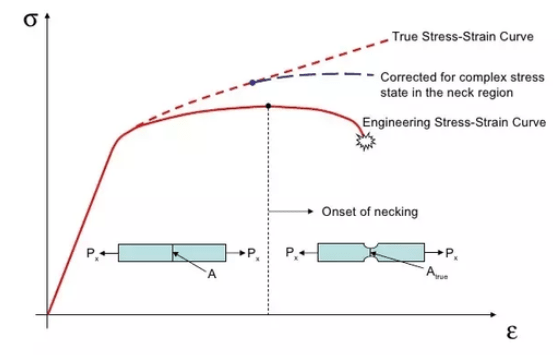
Since you are mathematically inclined the True stress-strain curve in some cases is mathematically invertible (compared to the engineering stress-strain curve).

Below is a comparison of the two (engineering vs true) for different materials.

enter image description here enter image description here
Stress strain for steel Stress strain for a ductile material without a specific yield point.
source facebook post source
$\endgroup$
7
  • $\begingroup$ Okay, so my interpretation of the tension test is fundamentally flawed. Is the constant displacement rate in these tensile tests exceedingly small such that a kind of quasi-static assumption is made at any point in time during loading? $\endgroup$ Jan 21, 2022 at 13:02
  • $\begingroup$ Yes usually the displacement rate is between 5 and 25 mm per minute (which is quite low), so the quasi static assumption is fair. $\endgroup$
    – NMech
    Jan 21, 2022 at 13:15
  • $\begingroup$ I see - if the quasi static assumption is valid, I will interpret any point (epsilon, sigma) on the stress strain curve as the load (sigma * cross section area) needed to keep the elongated specimen (with elongation given by epsilon) in a state of quasi equilibrium. Is that a good way to view it? $\endgroup$ Jan 21, 2022 at 13:34
  • $\begingroup$ For the engineering strain --as long as you use the original cross-section-- , that seems correct (although that is not the way I usually think about it). That is also true for the true stress strain curve with the difference that you would need to multiply with the "updated" value of the cross-section $\endgroup$
    – NMech
    Jan 21, 2022 at 13:41
  • $\begingroup$ Great; how do you think about it if not by some sort of equilibrium criteria? $\endgroup$ Jan 21, 2022 at 14:22
1
$\begingroup$

For engineering stress-strain curve, the only region where you would see basically two discrete strain values for one single value of stress is the necking, i.e. the region beyond Ultimate point on the curve. What happens there? The structure looses its stiffness and load bearing capacity, and just keeps on shrinking (in the necking area) without taking a significant amount of load. However, for the engineering stress-strain curve, since we use the initial parameters to determine the stresses and strains, this would mean that the strains are increasing (since the deformation is increasing) at the necking area, but the load taken by the structure keeps on decreasing. Now, since stress = F/A0 (where A0 is the initial area), the F (load taken by the structure) decreases hence the stress begins to decrease. Determining the load F taken by the structure during necking is also not an easy task, but they make some assumptions while finding it out during necking phase.

The structure becomes very complicated beyond the Ultimate point. Engineering stress-strain curve is not even utilized beyond this point since it doesn't represent the actual behavior of the material in a tensile test. Therefore, I am not in favor of having Engineering stress-strain curve beyond the Ultimate point, but they put it in the figures, not for usage but just for understanding. Even it becomes extremely difficult to obtain the proper True stress-strain curve in the necking region, because you need to track the instantaneous changes in the area at the region of necking, which are not at all an easy task.

$\endgroup$

Your Answer

By clicking “Post Your Answer”, you agree to our terms of service and acknowledge that you have read and understand our privacy policy and code of conduct.

Not the answer you're looking for? Browse other questions tagged or ask your own question.