One possible method to determine stability and capability is using control charts. Below is an example control chart representing an unstable process. The data points are represented in blue, which include few data points above the upper control limit (UCL - Purple line) and below the low control limit (LCL - Red line).

Below is data for the above chart. The data is Apple stock price for 15 days. Data is for illustration purpose only.
\begin{array}{| l | l | l | l | l | l | l | l | l | l |}
\hline
& & & & & & & \bar{X} Chart & \bar{X} Chart & \bar{X} Chart\\
Date & Open & High & Low & Close & \bar{X} & R & LCL & CL & UCL \\ \hline
3/19/2015 & 126.7& 127.2& 125.4& 125.5& 126.2& 1.8& 124.1& 126.1& 128.2 \\
3/18/2015 & 126.0& 128.6& 125.3& 127.4& 126.7& 2.7& 124.1& 126.1& 128.2 \\
3/17/2015 & 125.9& 127.2& 124.6& 127.0& 126.2& 2.6& 124.1& 126.1& 128.2 \\
3/16/2015 & 123.8& 124.9& 123.3& 125.4& 124.4& 2.0& 124.1& 126.1& 128.2 \\
3/13/2015 & 124.9& 125.9& 122.5& 123.5& 124.2& 3.3& 124.1& 126.1& 128.2 \\
3/12/2015 & 123.3& 125.9& 122.6& 125.4& 124.3& 3.2& 124.1& 126.1& 128.2 \\
3/11/2015 & 126.7& 126.2& 124.1& 123.7& 125.2& 3.0& 124.1& 126.1& 128.2 \\
3/10/2015 & 126.4& 127.2& 123.8& 124.5& 125.4& 3.4& 124.1& 126.1& 128.2 \\
3/9/2015 & 127.9& 129.5& 125.0& 127.1& 127.4& 4.5& 124.1& 126.1& 128.2 \\
3/6/2015 & 128.4& 129.3& 126.2& 126.6& 127.6& 3.1& 124.1& 126.1& 128.2 \\
3/5/2015 & 128.5& 128.7& 125.7& 126.4& 127.3& 2.9& 124.1& 126.1& 128.2 \\
3/4/2015 & 128.1& 129.0& 126.8& 128.5& 128.1& 2.2& 124.1& 126.1& 128.2 \\
3/3/2015 & 126.9& 128.0& 125.5& 127.3& 126.9& 2.4& 124.1& 126.1& 128.2 \\
3/2/2015 & 126.2& 127.2& 125.3& 126.0& 126.2& 1.9& 124.1& 126.1& 128.2 \\
& & & & & 126.1& 2.8 \\
& & & & & \bar{\bar{X}} & \bar{R} \\ \hline
\end{array}
Steps for the Chart
- $\bar{X}$, Average of observation
- $R$, Range , Max - Min
- $\bar{\bar{X}}$, $\bar{R}$, Average of $\bar{X}$ and Average of Range
- The center line of $\bar{X} Chart$ is $\bar{X}$
- LCL and UCL lines for $\bar{X} chart$ use $\bar{X}$ equation
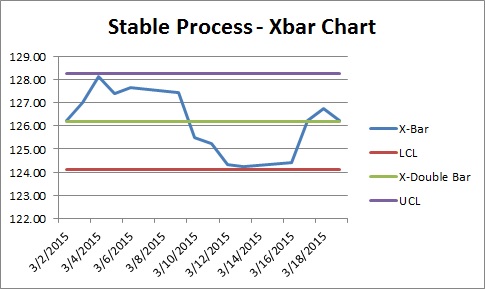
Below is a control chart representing a stable process. All data points are between LCL and UCL.

Note: The data has been adjusted to illustrate a stable process
If the specification limits (Upper specification limit: USL and low specification limit: LSL) are outside of both the LCL and UCL then the process is considered a capable process.

