4
$\begingroup$

I'm dealing with hot combustion products flowing through heat exchangers and I'd like to perform some calculations regarding the flow properties (velocity, temperature, pressure and density) as it passes trough the heat exchanger.

I've a 1D model already built and I'd like to test it and validate it, but I'm lacking some critical information.

Is there any place where I can find the absolute viscosity [Pa*s] as a function of temperature (for pressures of 1atm, or close to it) for some select gases?

I need to know the viscosity between 300K and 2500K for gaseous CO2, H2O, N2 and O2. In polynomial form (something similar to the NASA/JANAF polynomials) would be nice, but in table would also be good.

I've already tried NIST, but it doesn't have that information for the temperature range I'm interested in.

Is it possible to run a macro for FLUENT, Star ccm+ or OpenFOAM and get those values from those programs? I have legal access to all of them.
$\endgroup$
7
  • $\begingroup$ Can't you generate the table yourself using NASA polynomials? Most probably any table containing these data will be generated this way. $\endgroup$
    – Algo
    Commented May 8, 2016 at 11:58
  • $\begingroup$ You can also check the CoolProp library. $\endgroup$
    – Algo
    Commented May 8, 2016 at 12:00
  • $\begingroup$ Thanks, I'l check the library. The problem is not being able to generate the polynomials. The problem is that I'm not being able to find data for high temperatures. $\endgroup$ Commented May 8, 2016 at 13:33
  • $\begingroup$ The method used in chemkin should take care of this pretty well. Described here. Equations and tables. $\endgroup$
    – Dan
    Commented May 9, 2016 at 10:25
  • $\begingroup$ Thanks! Can you put the link to the equations? I'm not finding them. $\endgroup$ Commented May 12, 2016 at 16:40

2 Answers 2

1
$\begingroup$

See NASA's computer program CEA (Chemical Equilibrium with Applications). From this site you can download an application to perform calculations. This application contains a text file called trans.inp with coefficients, $A$ through $D$, for an empirical dynamic viscosity equation: $$\ln\eta=A\ln T+\frac{B}{T}+\frac{C}{T^2}+D$$ and for thermal conductivity: $$\ln\lambda=A\ln T+\frac{B}{T}+\frac{C}{T^2}+D$$

with $T$ in Kelvin, $\eta$ in $\mu$P (or $10^{-7}$Pa s), and $\lambda$ in $\mu$W/cm K (or $10^{-4}$W/m K).

The file contains coefficients for multiple temperature ranges (up to 10,000 K for CO$_2$ and 15,000 K for H$_2$, N$_2$, and O$_2$) and also for binary interaction parameters, e.g., $\eta_{ij}$ for species $i$ and $j$, required for obtaining the viscosity of mixtures.

From this site one can download NASA report RP-1311 which describes how to obtain viscosity of mixtures (see section 5.2.1) and RP-1311-P2 describing the file format (see TABLE E.1).

$\endgroup$
1
$\begingroup$

Andre, I assume you've got an answer to this question by now; please tell us how you solved it! – NauticalMile

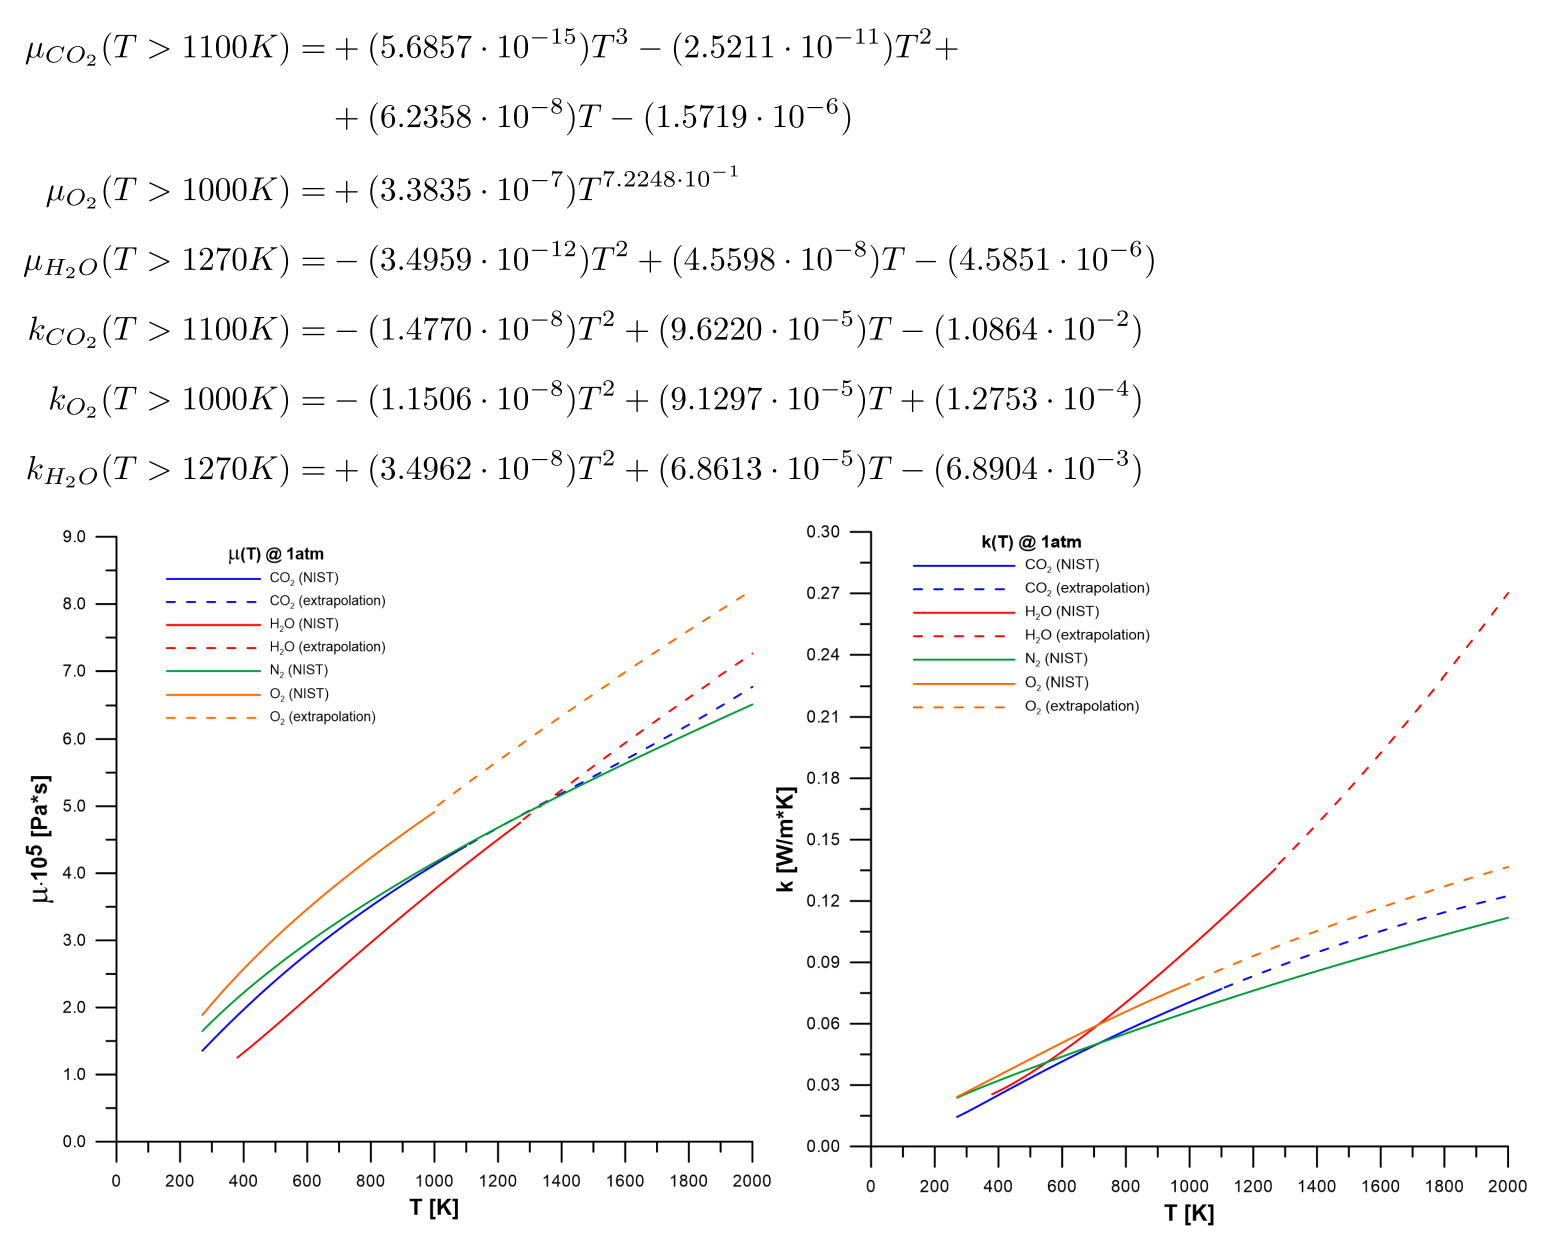
Unfortunately I didn't found any information regarding the high temperature values for the viscosity nor the conductivity for those gases. I used a very crude method to get around the issue. Basically, I interpolated the available data using some functions up to the upper temperature limit of the available data (usually around 1000K), and then used the obtained functions to extrapolate up to 2000K. The functions where selected on the basis that "they maintained the general tendency on the behavior of the available data up to the maximum limit of 2000K, not allowing for any sharp inflexions or other oscillatory phenomenon". This method is extremely crude, but my application did not require very high precision. You can read it further in my Master's thesis (the work where I used this information). When the document is available to the general public I'll post the link here. Bellow is a figure of the used equations and the available data vs. interpolating/extrapolating functions. Note some discontinuity where the data from NIST (full lines) meet the extraplations (dashed lines): enter image description here

$\endgroup$

Your Answer

By clicking “Post Your Answer”, you agree to our terms of service and acknowledge you have read our privacy policy.

Not the answer you're looking for? Browse other questions tagged or ask your own question.