4
$\begingroup$

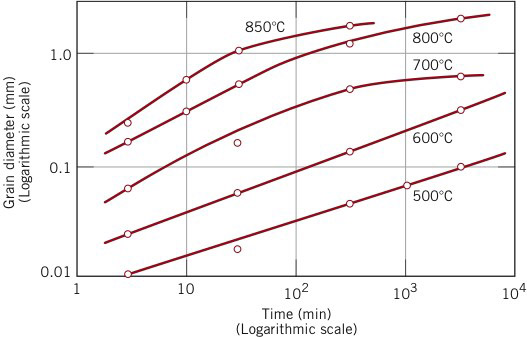
An uncold-worked brass specimen of average grain size 0.009 mm is heated to 600 degrees Celsius for 1000s, what is the average grain size based on this graph?

enter image description here

How to tackle this problem? I don't know if I am using the graph correctly. My approach was:

1000s is 16.67 min, $\log(16.67) = 1.22$

So $\frac{22}{100}$ between 10 and 102. Which is about 0.67 cm to the right of 10 on x-axis.

Now lets estimate this corresponds to 10-1.333 on the y-axis of the 600 degrees celcius graph line. So 0.046 mm.

But this does not seem correct, because I did not incorporate the 0.009 mm starting position. Which corresponds to heat treatment time of about 1 min at 600 degrees so should I add 1 min to the 1000s? And thus look look at the point on the graph at 17,76 min?

The answer in book seems way off, they talk about average grain size 0.2 mm. To me that seems like they looked at the graph of 700 degrees Celsius.
$\endgroup$
2
  • $\begingroup$ I've been trying to understand this for awhile, and it is baffling to me. Usually grain growth is taught in an idealized fashion where the material is pure and grain growth follows approximately the same physics as bubbles (i.e. surface tension of the boundaries), yielding $d^2 - d_0^2 = kt$ where $k=k_0 e^{\frac{-Q}{RT}}$ and $k_0$ is a material constant and $Q$ is an activation barrier for boundary motion. However this breaks down in the presence of solute (as in brass), precipitates, volume defects, etc. There are no obvious laws (I am aware of)... $\endgroup$ Commented Apr 27, 2016 at 15:17
  • $\begingroup$ ...that allow one to compute final from initial size for this type of problem. With anything like solute, etc, the problem becomes one of kinetics, which typically requires some kind of numerical solution or experimental values. While the graph offers experimental values, your problem appears to have either some typographical errors, or else is making some non-obvious, non-trivial assumption about the data in the graph. $\endgroup$ Commented Apr 27, 2016 at 15:18

2 Answers 2

1
+50
$\begingroup$

The recrystallization temperature for brass is <400 Celsius (Harding et al., 1980), so the original microstructure won't affect the results here.

Your process seems good, and my guess would be the answer in the book was either from the 700 Celsius line or 1000 min on the 600 Celsius line.

$\endgroup$
2
$\begingroup$

Grain growth is the movement of grain boundaries by diffusion to reduce the grain boundary area. This graph tells that at 600 degrees, a treatment of one minute shall give the y coordinate of the 600 degrees graph. So treating a sample for 1000s shall mean heating the sample at 600 from time t=0.0. The starting point is inherent in the process itself.

$\endgroup$
1
  • $\begingroup$ +1. I know this is a long-shot, but since you talked about grain boundaries I wonder if you have any idea how to answer this question? It's been one of our longest-lasting unanswered questions and I'd really like to clean up the unanswered queue! $\endgroup$ Commented Jun 22, 2021 at 2:34

Your Answer

By clicking “Post Your Answer”, you agree to our terms of service and acknowledge you have read our privacy policy.

Not the answer you're looking for? Browse other questions tagged or ask your own question.