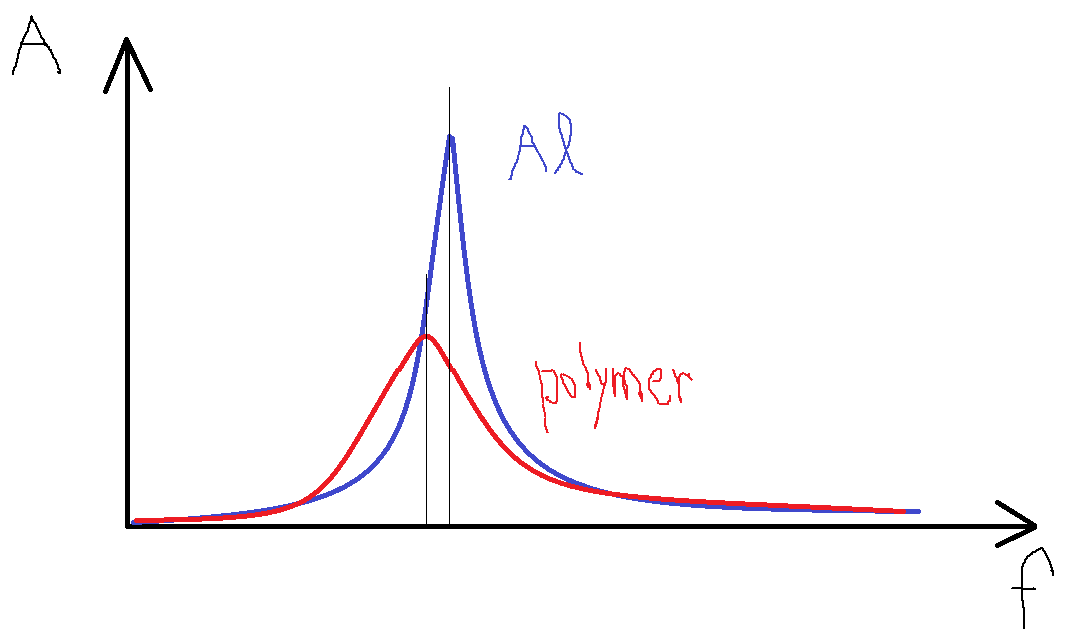
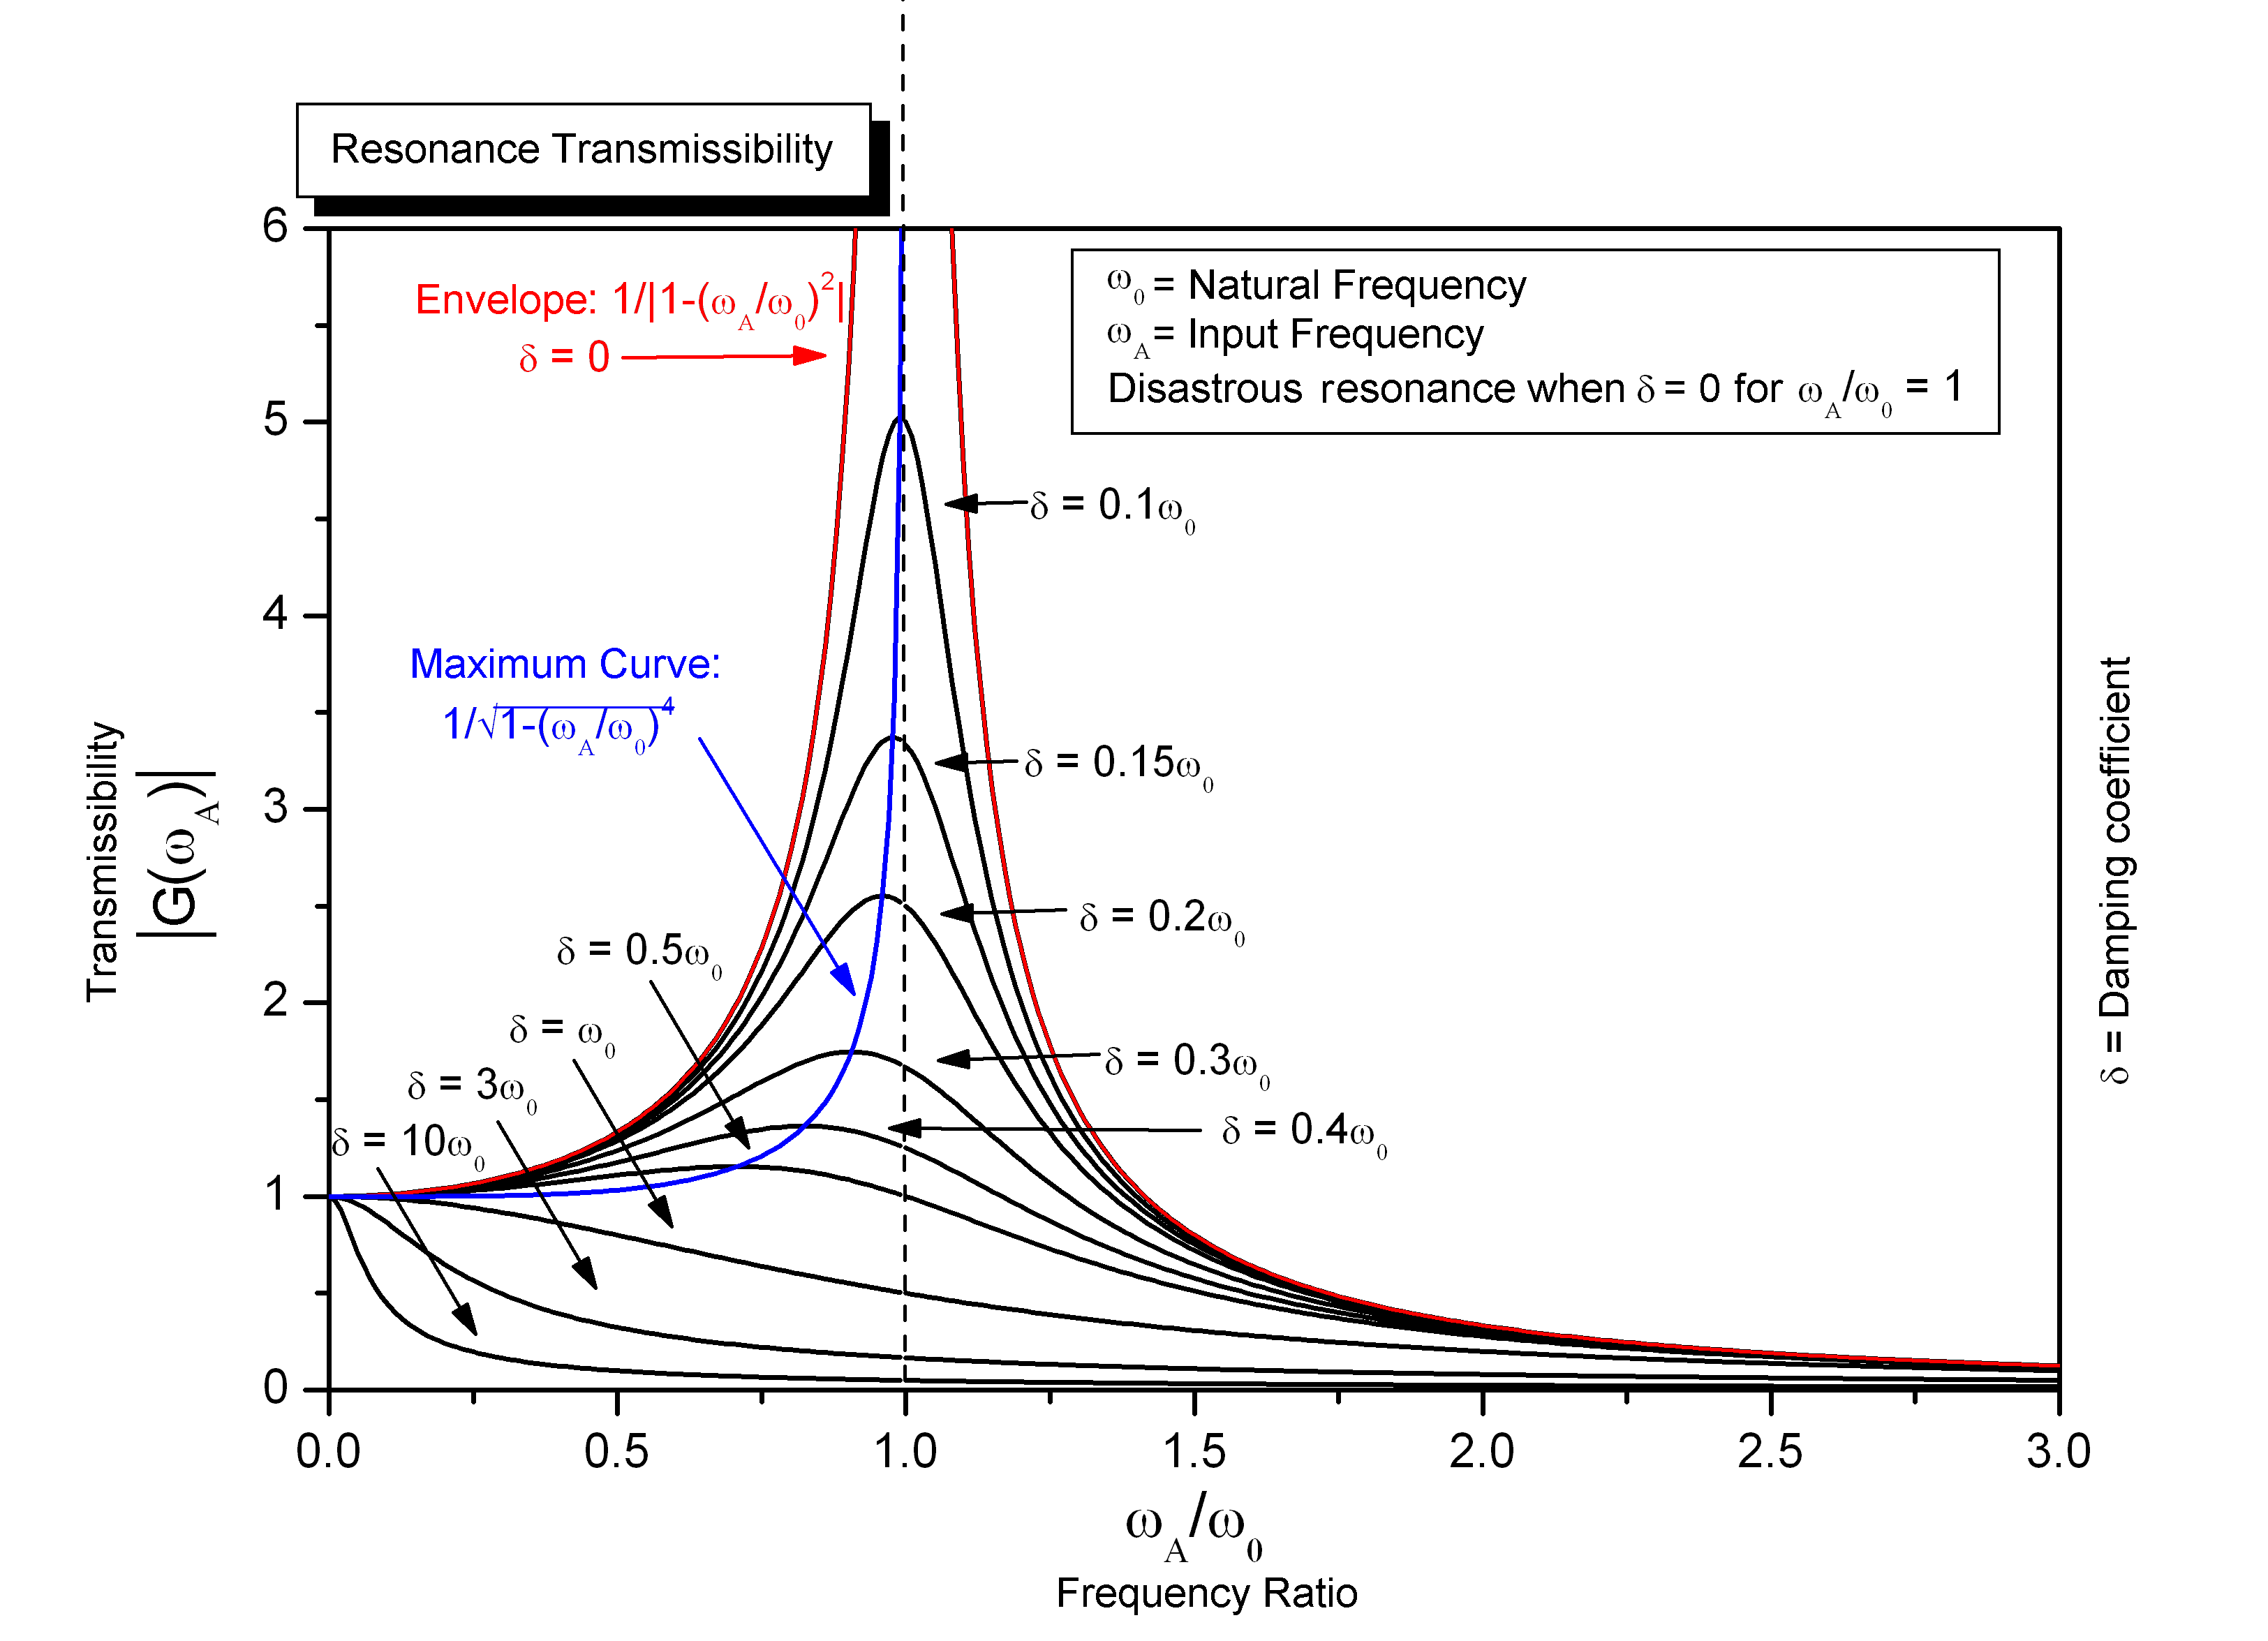
I would like to compare the shape of the frequency spectrum of a plastic and aluminium component. Now if we assume that the plastic and aluminium component only differ in the material, while the mass and stiffness stay the same (I know, large assumption), how would generally differ the shape of the frequency spectrum from each other? Obviously, the damping plays a major role here and would be much higher in case of plastic, therefore the response amplitude would be lower, the resonance zone wider and a shift (which is many times neglected) towards a lower frequency would be made... Could I in a very simplified version, just for the sake of understanding, draw it like this?
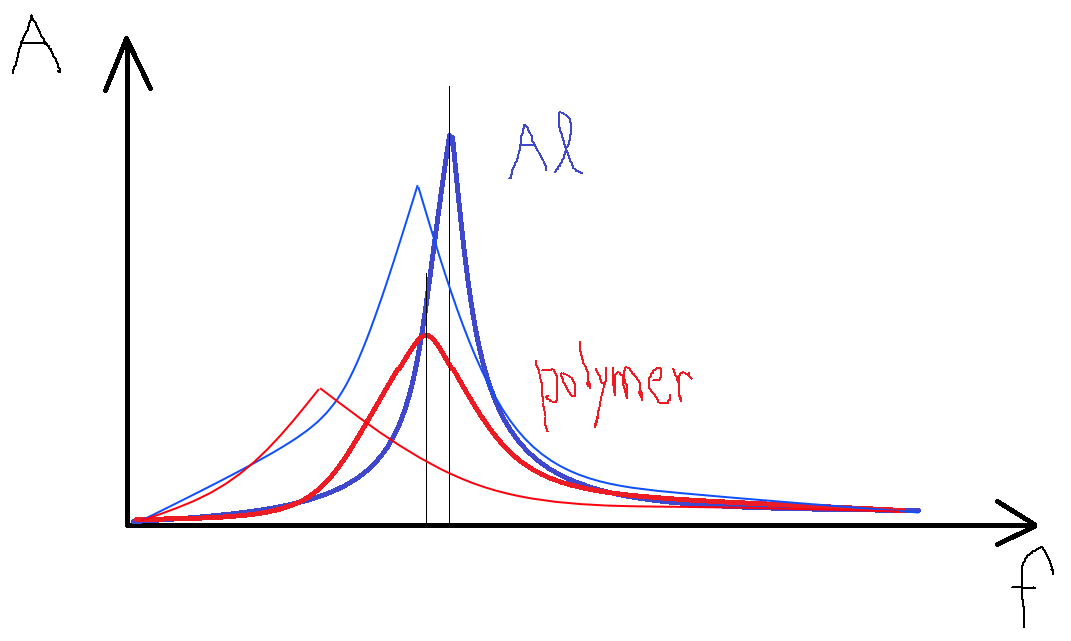
 Another question would be the temperature dependence of the elastic modulus. If the temperature rises, the modulus is reduced which also affects the eigenfrequency. In case of aluminium not so much, but in case of plastics, the difference can be enormous. My understanding is that in case of elevated temperatures, the damping increases; in case of plastic much more than in case of aluminium. Could I visualize this as:

Any constructive answers are much appreciated! Kind regards,
Luka
